

Learning Needs of Designers in Singapore — A Quantitative Study
Xinran Ning is an undergraduate from Yale-NUS College who was interning with Studio Dojo over the summer holidays. Over the past year, she grew interested in design as a possible career for herself after learning about how it could provide a powerful lens with which to understand and solve complex problems in the world. This Learning Needs Survey project is her first attempt at conducting quantitative analyses of survey results and then converging upon some insights that might be useful for the design community. As a complete beginner in quantitative analysis, for this project she tried her hand at cleaning up the data, clustering the data, and conducting exploratory data analysis (EDA) using the software she was most familiar with – RStudio.
What are the learning needs of designers in Singapore? Are our learning spaces adequately meeting these needs?
Introduction
This is the full version of this article. Read the condensed article – 5 Thought-Provoking Insights on the Learning Needs of Designers in Singapore.
What are the learning needs of designers in Singapore? Are our learning spaces adequately meeting these needs? This was the curiosity that led Studio Dojo to send out a survey to designers in Singapore in August last year. Over 60 individuals responded, from a range of seniority levels and backgrounds.
In this article, I will share five insights that stood out for me after analysing this survey, as well as details about my process for analysing this quantitative study. Whether you are new to design and still learning the ropes, or a design leader hoping to better support your team, I hope you find the insights in this article meaningful in some way!
This article consists of three sections: 1) Setting the stage, where I give more details about the project and the preparation of the data; 2)The top 5 thought-provoking insights, where I present the research questions, graphs and insights; and 3) Conclusion, where I look at the statistical significance, the limitations, and the ‘what’s next’ of the project.
Setting the stage
About the project, the approach and the data
1. About the project
This project started as a way to collect data about and make sense of the learning needs of designers in Singapore, and to glean insights about how the learning space and/or design community has been able or unable to support these needs. Increasingly in the workplace in the 21st century, designers are expected not just to ideate, prototype and implement novel ideas to complex solutions, but they are also now asked to take on a variety of other tasks, like facilitate design sessions, improve team workflows and manage project stakeholders.
How are designers in Singapore adapting to the changing demands of their workplaces? Where do their current interests lie and what are they looking for in the learning space for designers in Singapore? In order to obtain some data on these big questions, we sent out a survey to the DesignSG Telegram group last year. This article summarises the results of the analysis I’ve done on the survey results. I hope this article provides you with some insight on the questions above, and kickstart a discussion on how the learning space in Singapore might be designed to better support the learning needs of designers in Singapore.
In the analysis of the survey results, I focus on 3 main factors. Out of the 15 questions that we asked in the survey, I zoomed in on 5 questions across these 3 main factors. The rationale for choosing these questions was that they were either the most relevant questions to the 3 factors, or they were relatively easier to process using quantitative methods. Questions that were not included were either not related to these 3 factors, or they were ‘pick all that apply’ questions that did not lend themselves easily to categorisation.
The 3 main factors and their accompanying questions are:
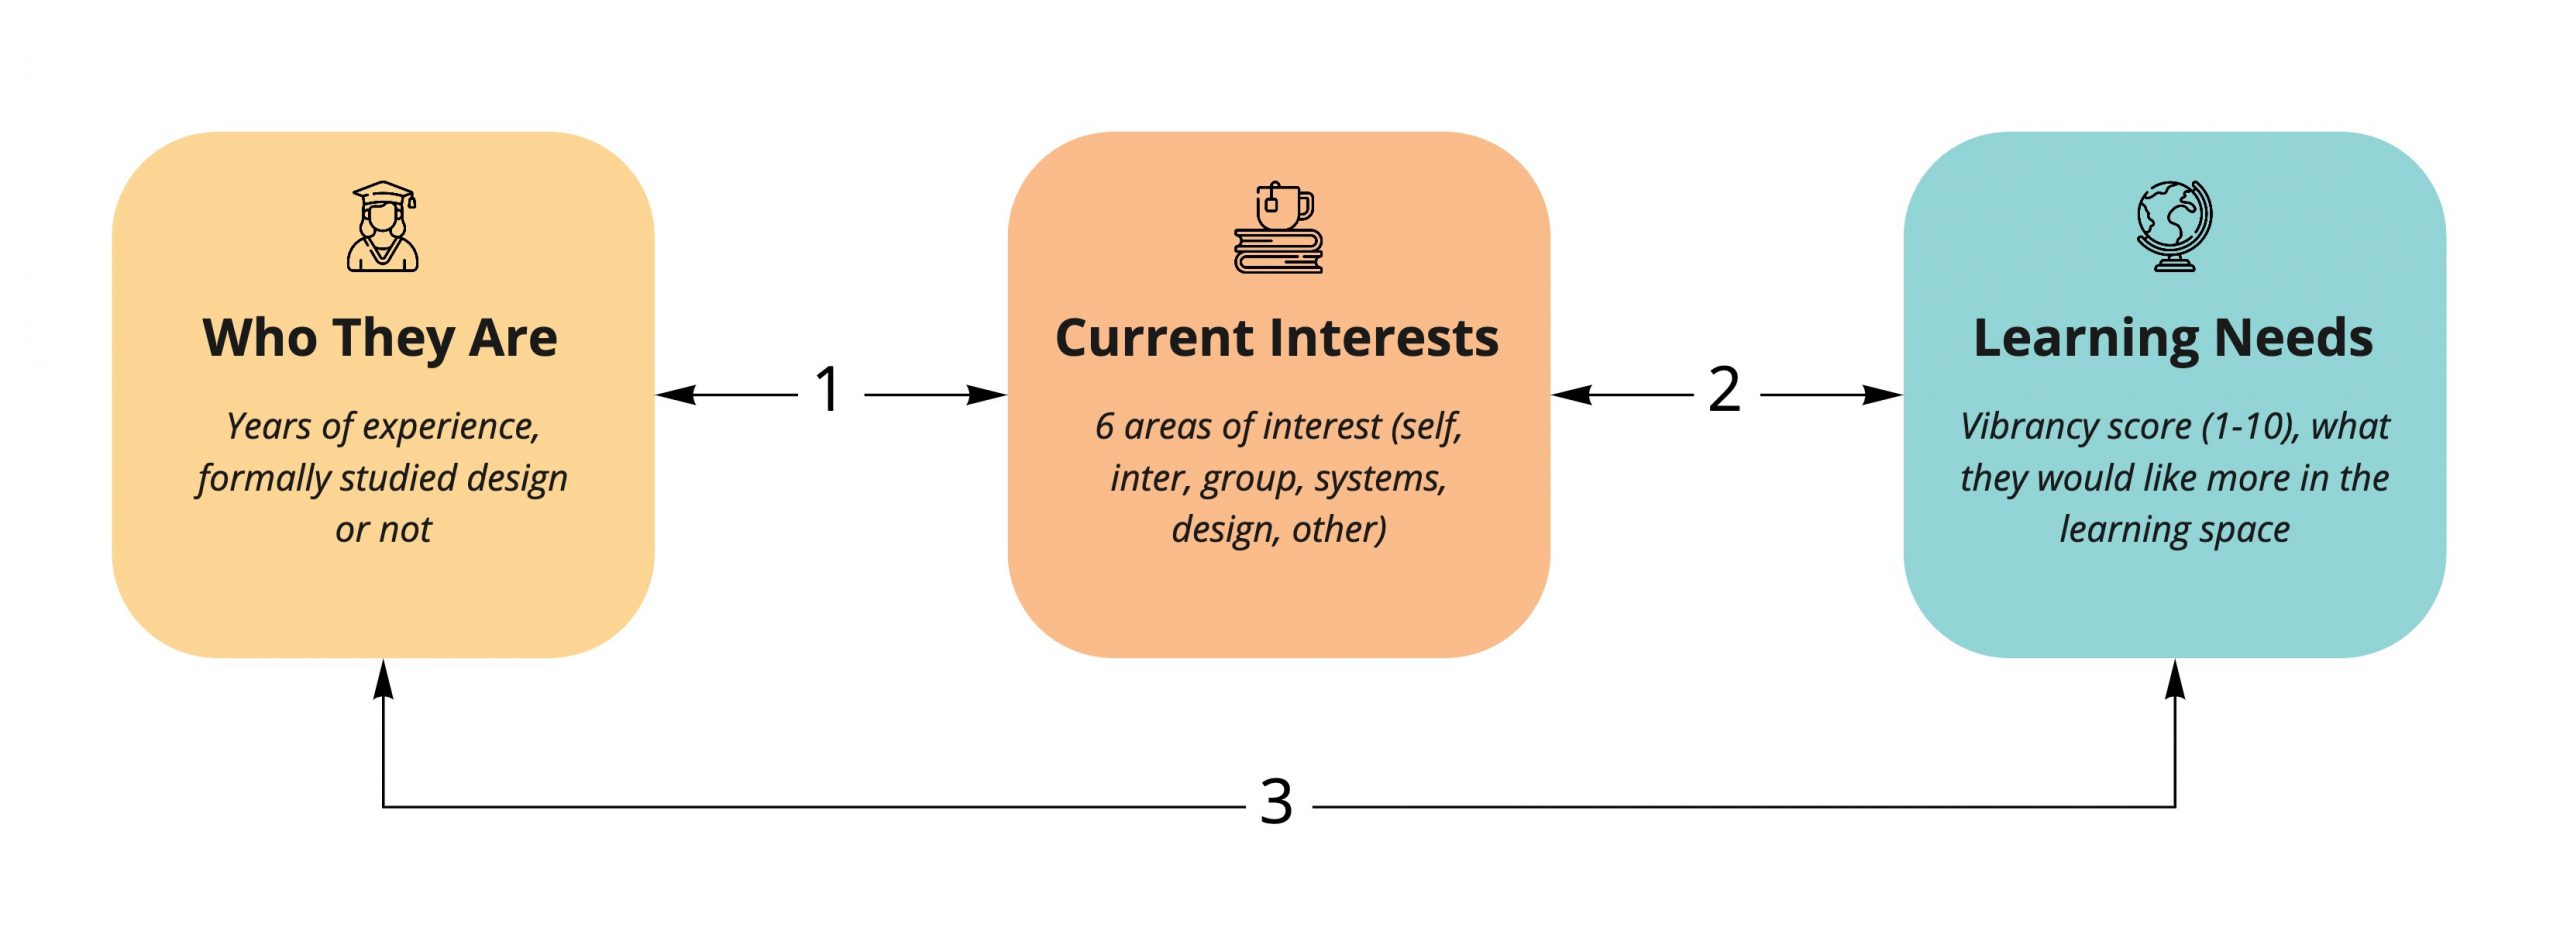
- Who our respondents are
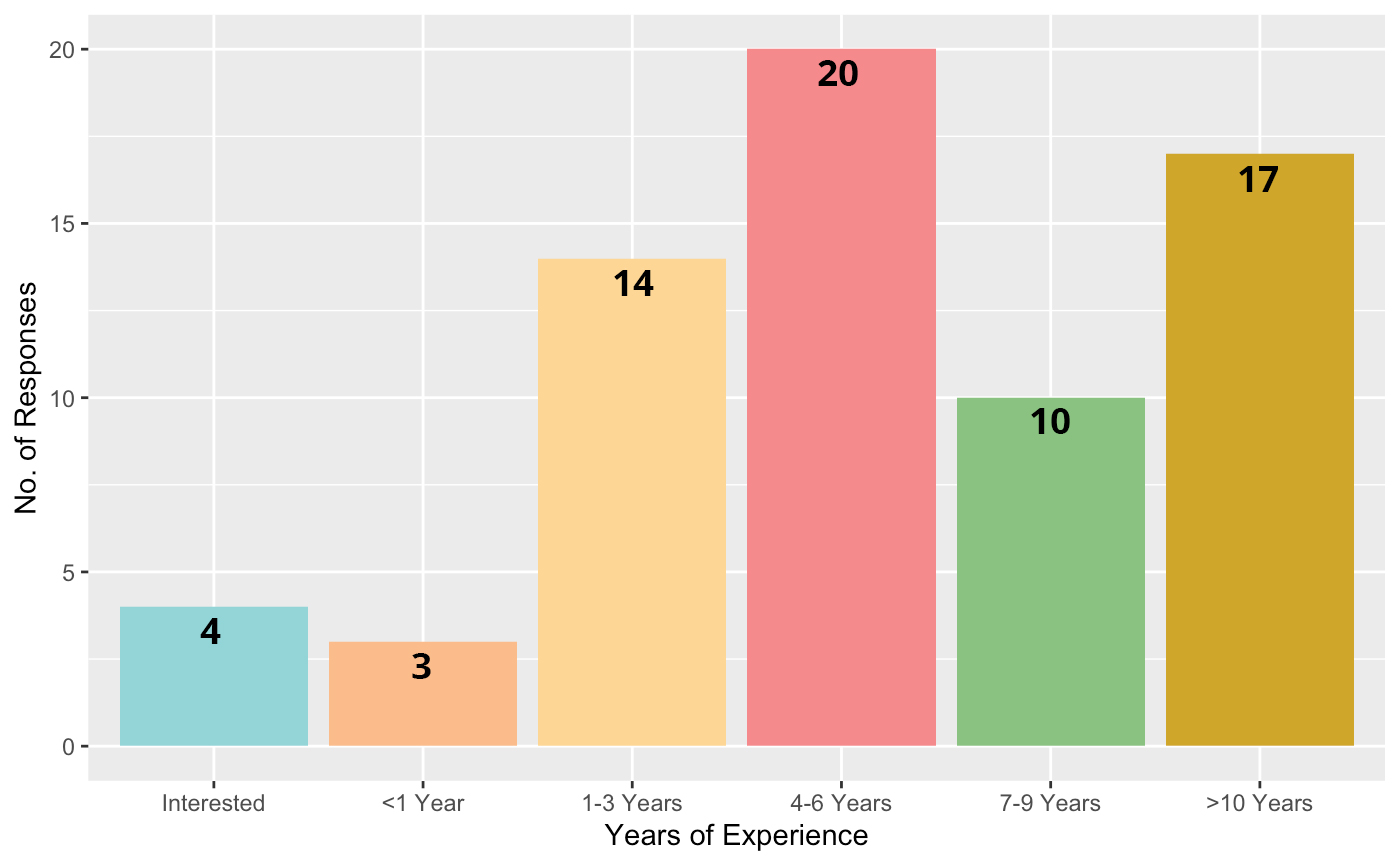
The questions I look at are:- Qn 3: How long have you worked in design?
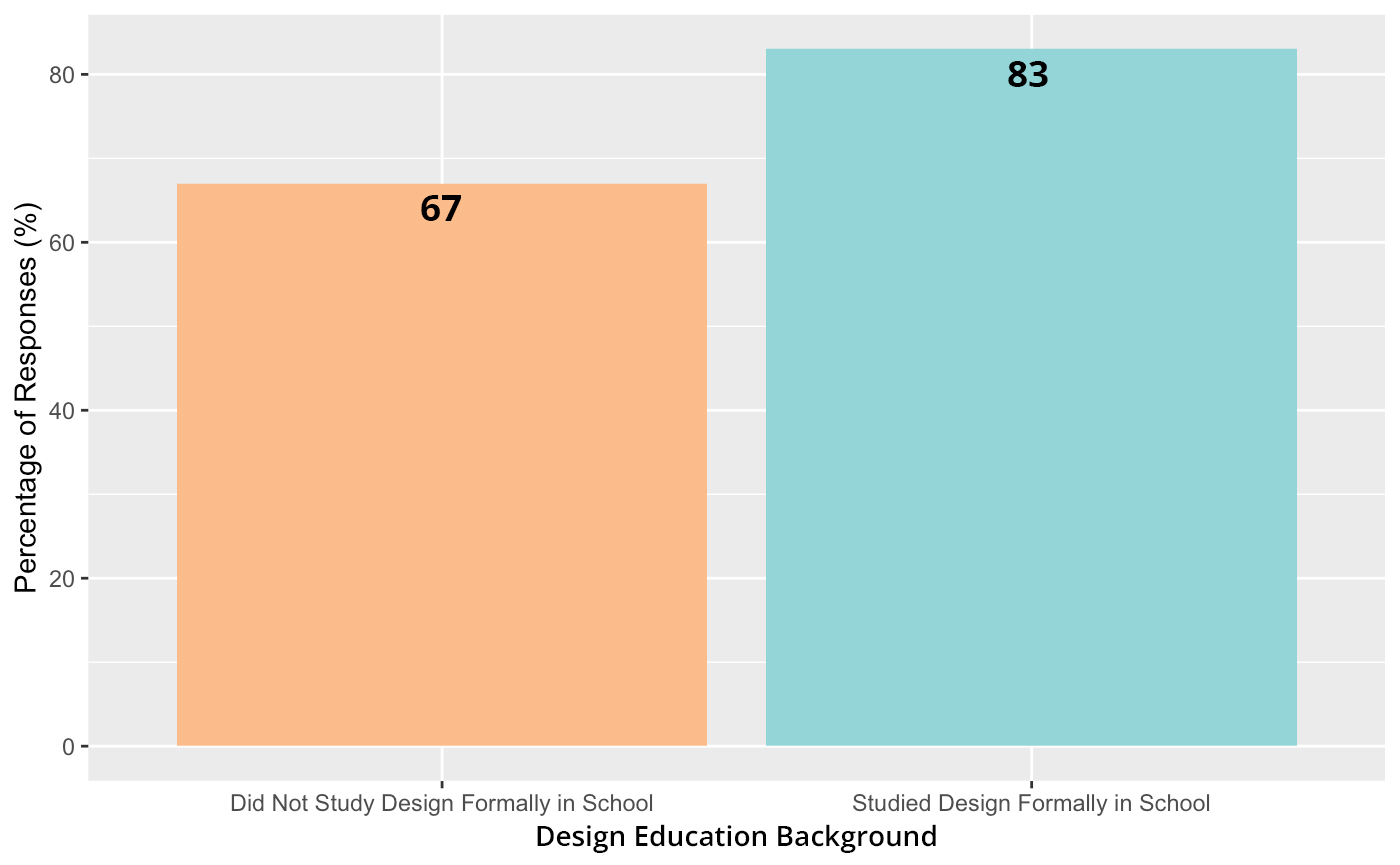
- Qn 7: Did you formally study design in school?
- What learning interests they currently have
- Qn 11: What topic(s) are you currently learning or interested to learn about?
- What their learning needs are
- Qn 14: How vibrant do you find the learning space for design in Singapore to be?
- Qn 15: What would you like more of in the learning space for design in Singapore?
These three main factors give us 3 sets of relationships between them that we are interested in learning more about. The three sets of relationships are:
- How ‘who the respondents are’ affect ‘what learning interests they currently have’
- How ‘what learning interests they current have’ affect ‘what their learning needs are’
- How ‘who the respondents are’ affects ‘what their learning needs are’
3. About the data
In this section I provide information and graphs on the distribution of each variable I mentioned above and, where relevant, explain how I clustered the qualitative and Fill in the Blanks questions.
Factor #1 – Who Our Respondents Are
Qn 3: How long have you worked in design?
Qn 7: Did you formally study design in school?
Factor #2 – What learning interests they currently have
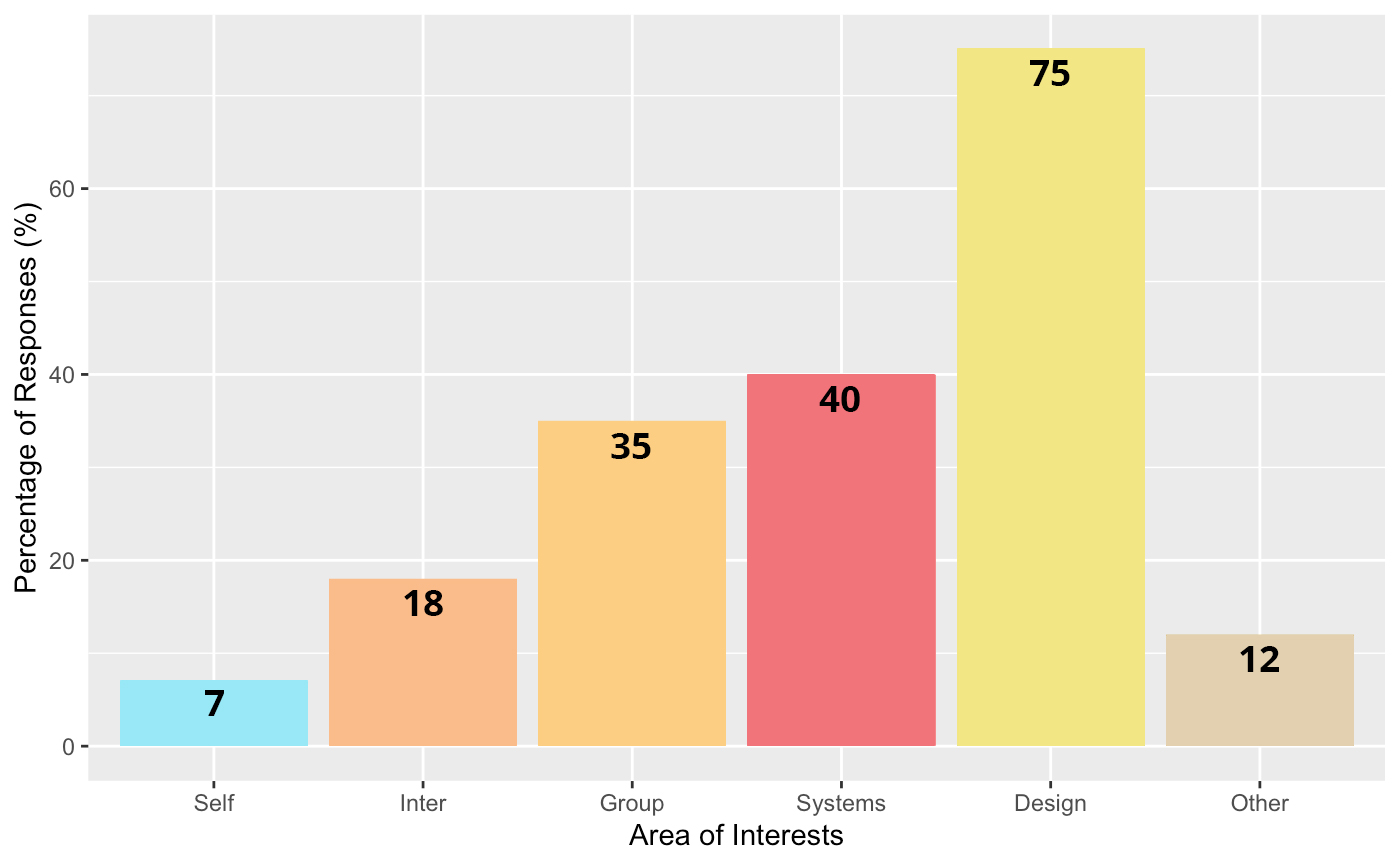
Qn 11: What topic(s) are you currently learning or interested to learn about?
As this was a Fill in the Blanks question, I had to categorise the responses in order to do quantitative analysis. The challenge was to do so in a manner that preserved as much data as possible in as little groups as possible.
I categorised the topics of interest into six mutually exclusive ‘areas’: the first four were taken from a framework known as the Gestalt levels of system framework, the fifth was for what I interpreted as design-related skills, while the last category (‘other’) contained interests that did not fall under either the levels of system framework or design-related skills. I chose to categorise the responses in this manner because I found the Gestalt framework extremely useful in understanding how people worked together in systems. The two other categories were meant to capture responses of skills that did not directly relate to working with people. The most common responses I obtained for each of the categories is presented in the infographic below:
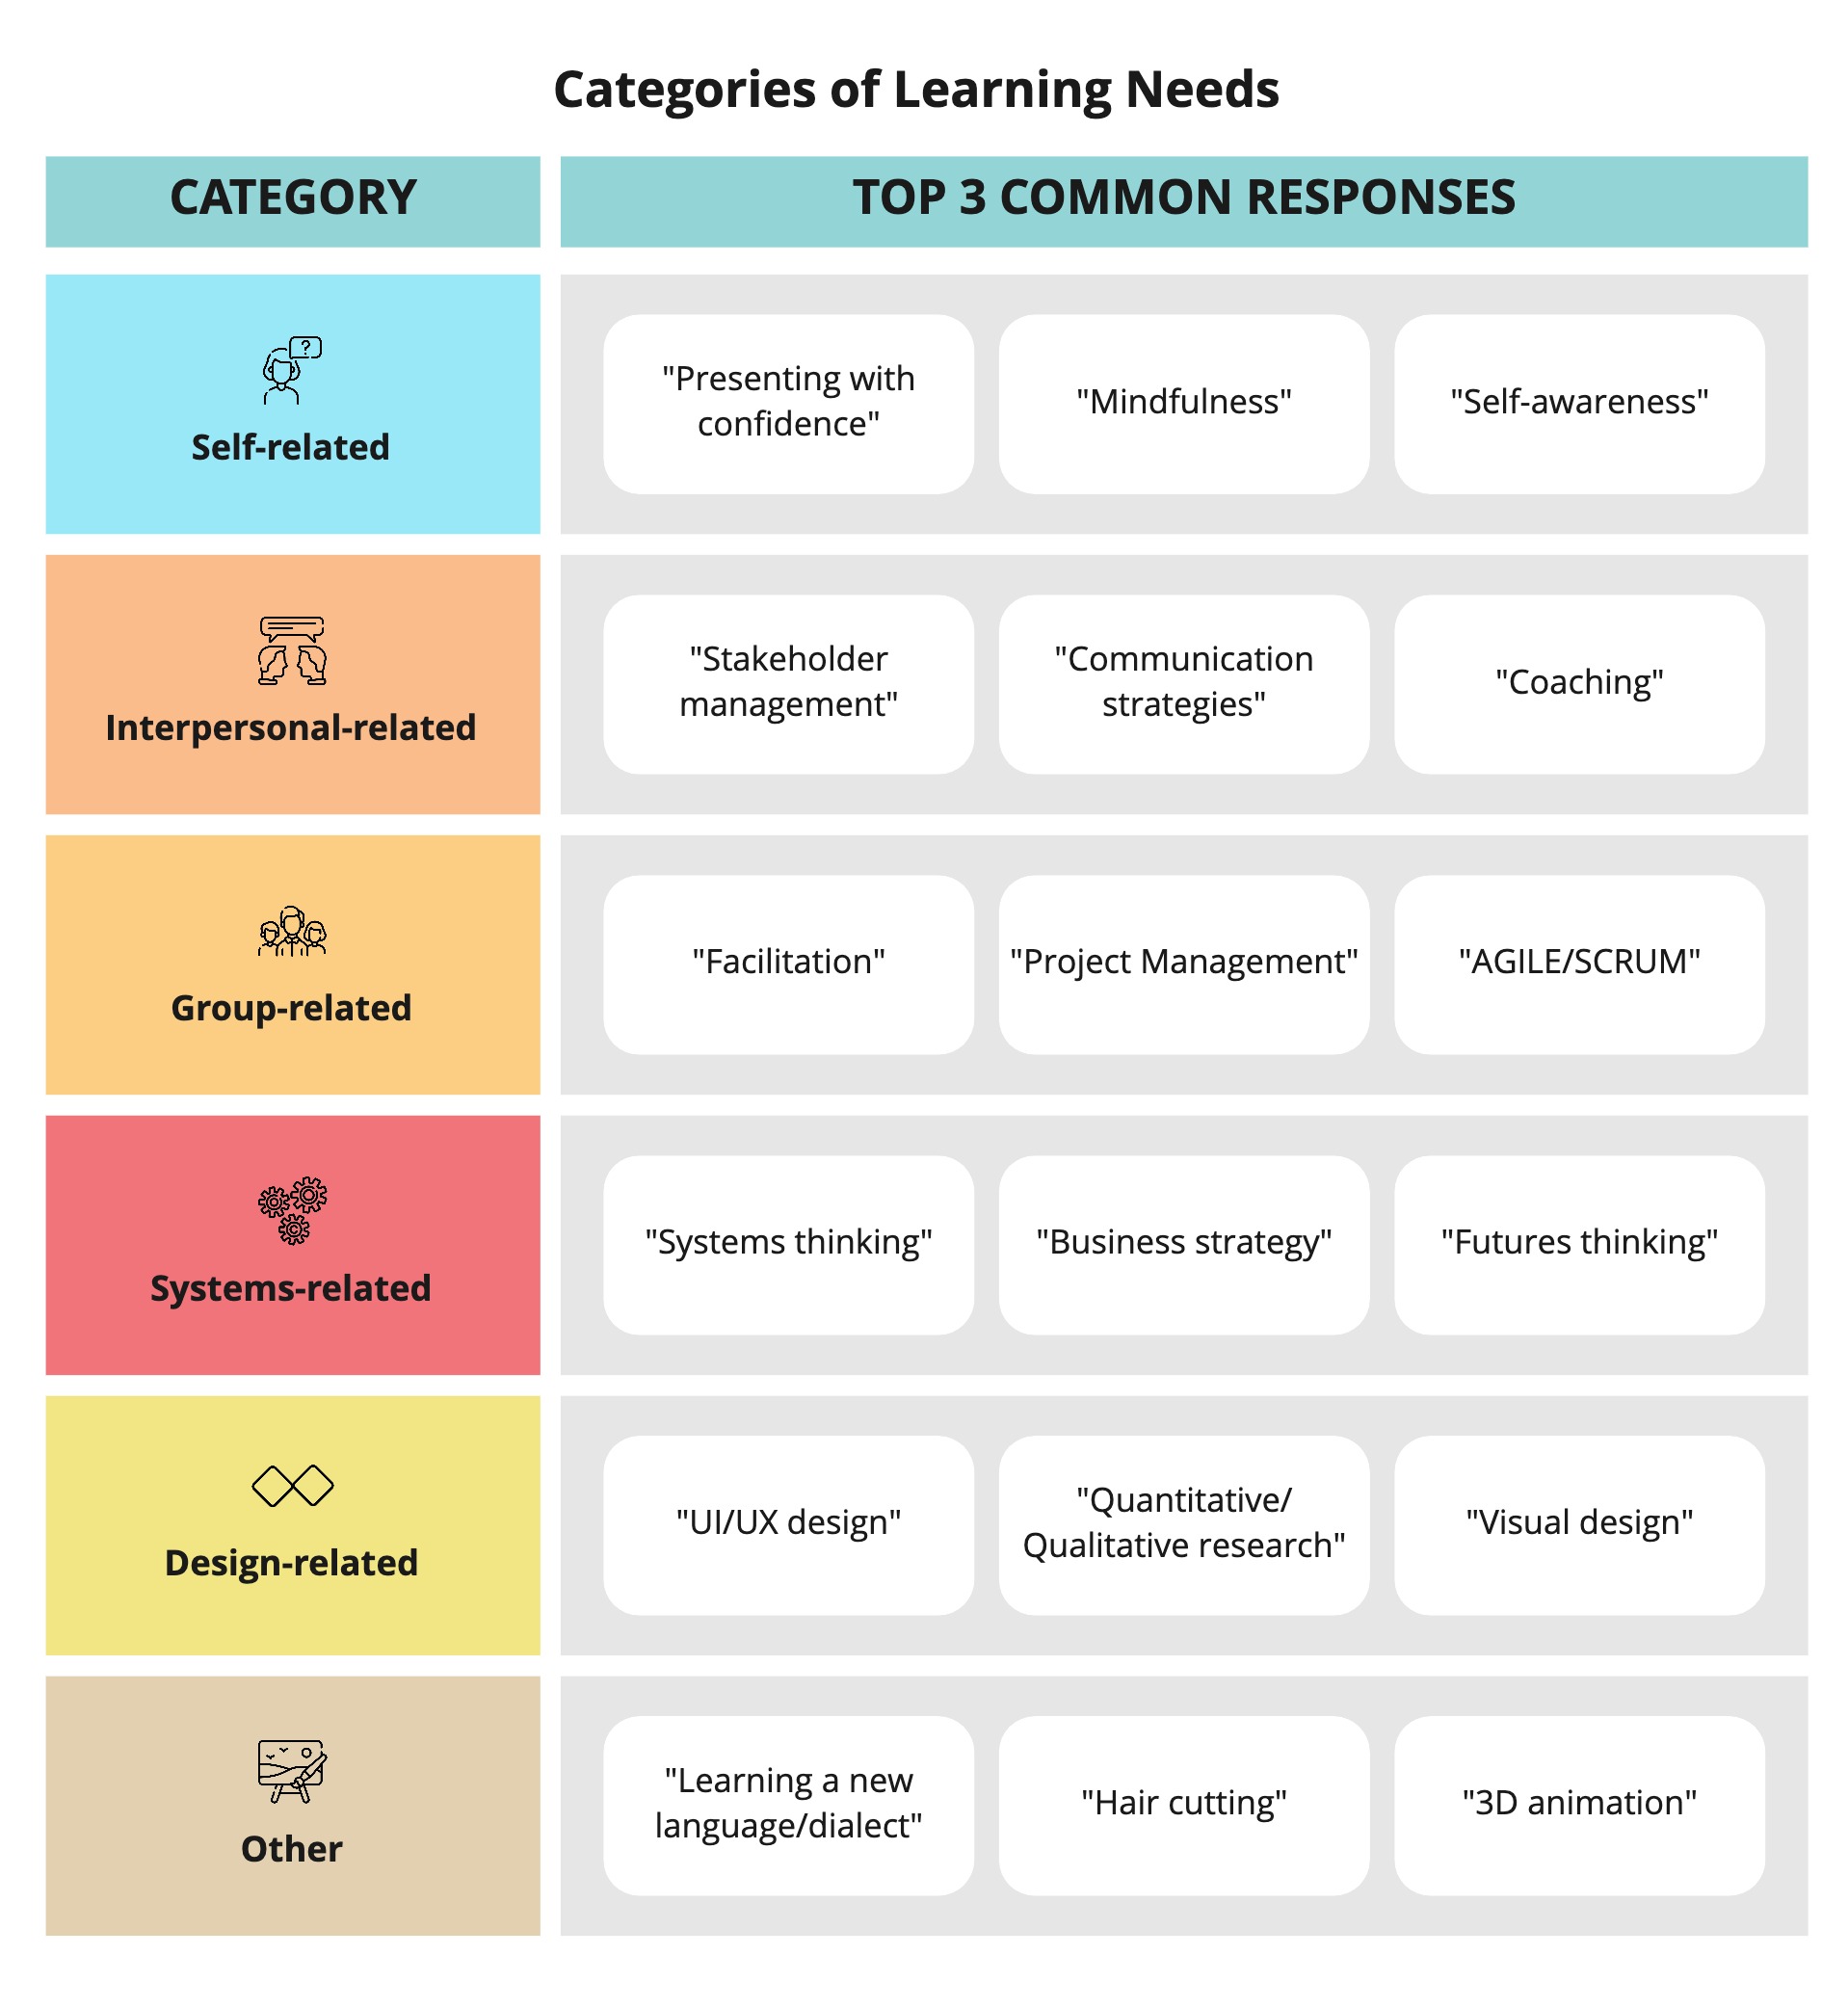
I take these categorisations as completely subjective and slightly arbitrary at times, and are only meant as one of many approaches to make sense of the results to this survey question. Hence, I understand that other forms of clustering would likely significantly affect the results and bring about further distinct insights.
That said, given the above approach of categorising learning interests, the distribution of responses is as follows:
Factor #3 – What their learning needs are
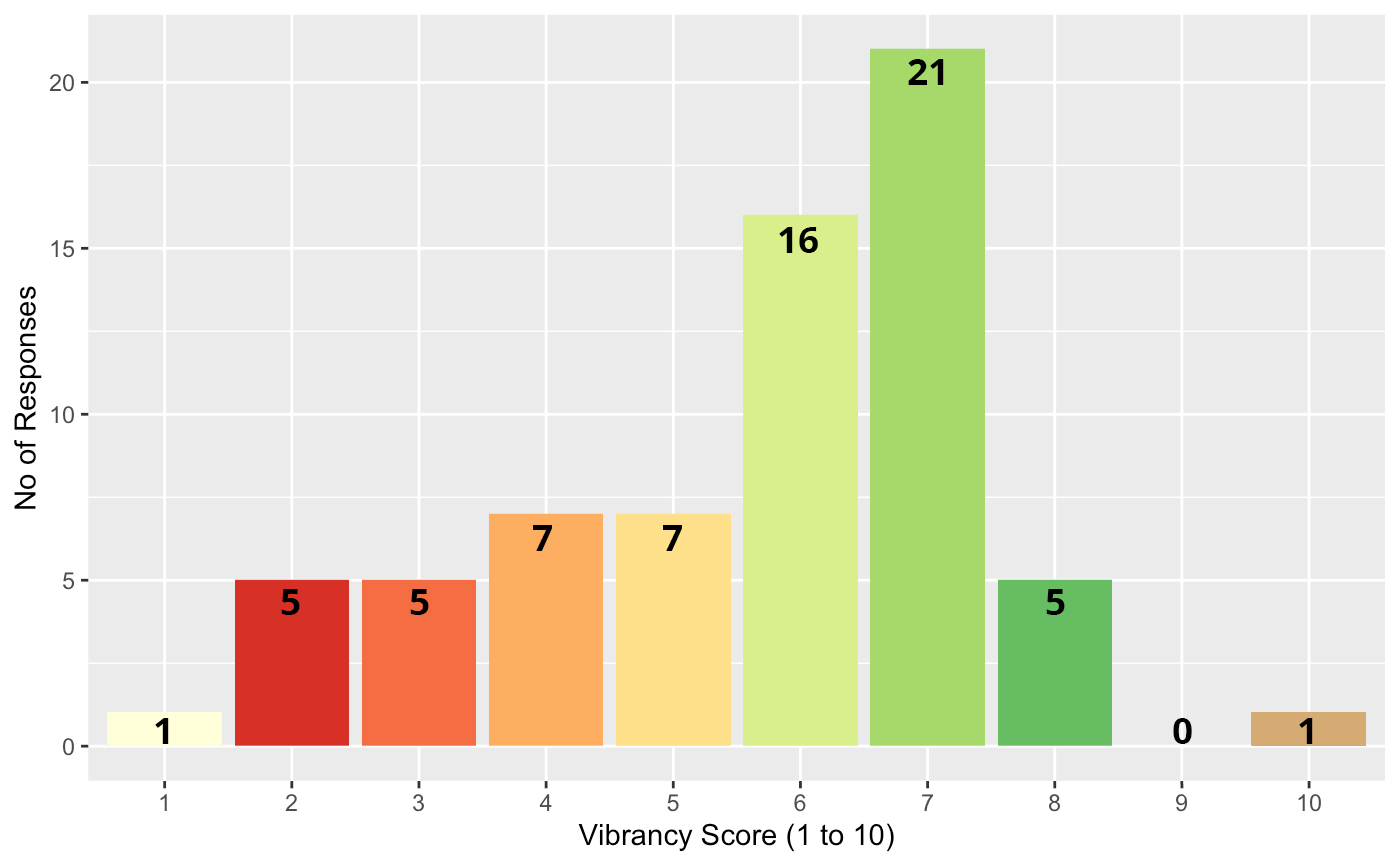
Qn 14: [On a scale of 1 to 10,] how vibrant do you find the learning space for design in Singapore to be?
Qn 15: What would you like more of in the learning space for design in Singapore?
As this is also a qualitative, Fill in the Blanks question, I again took the liberty of clustering the responses into different categories. In order to obtain meaningful results, I had use as little categories as possible so that I could still preserve the essence of the response while ensuring that there is a sufficient number of responses in each category. I decided to generate the 4 key headers based on the learning style of the suggestion in the responses, as each learning style has a key type of support required that is distinct from other learning styles. The 4 key categories for this question are presented in the infographic below.
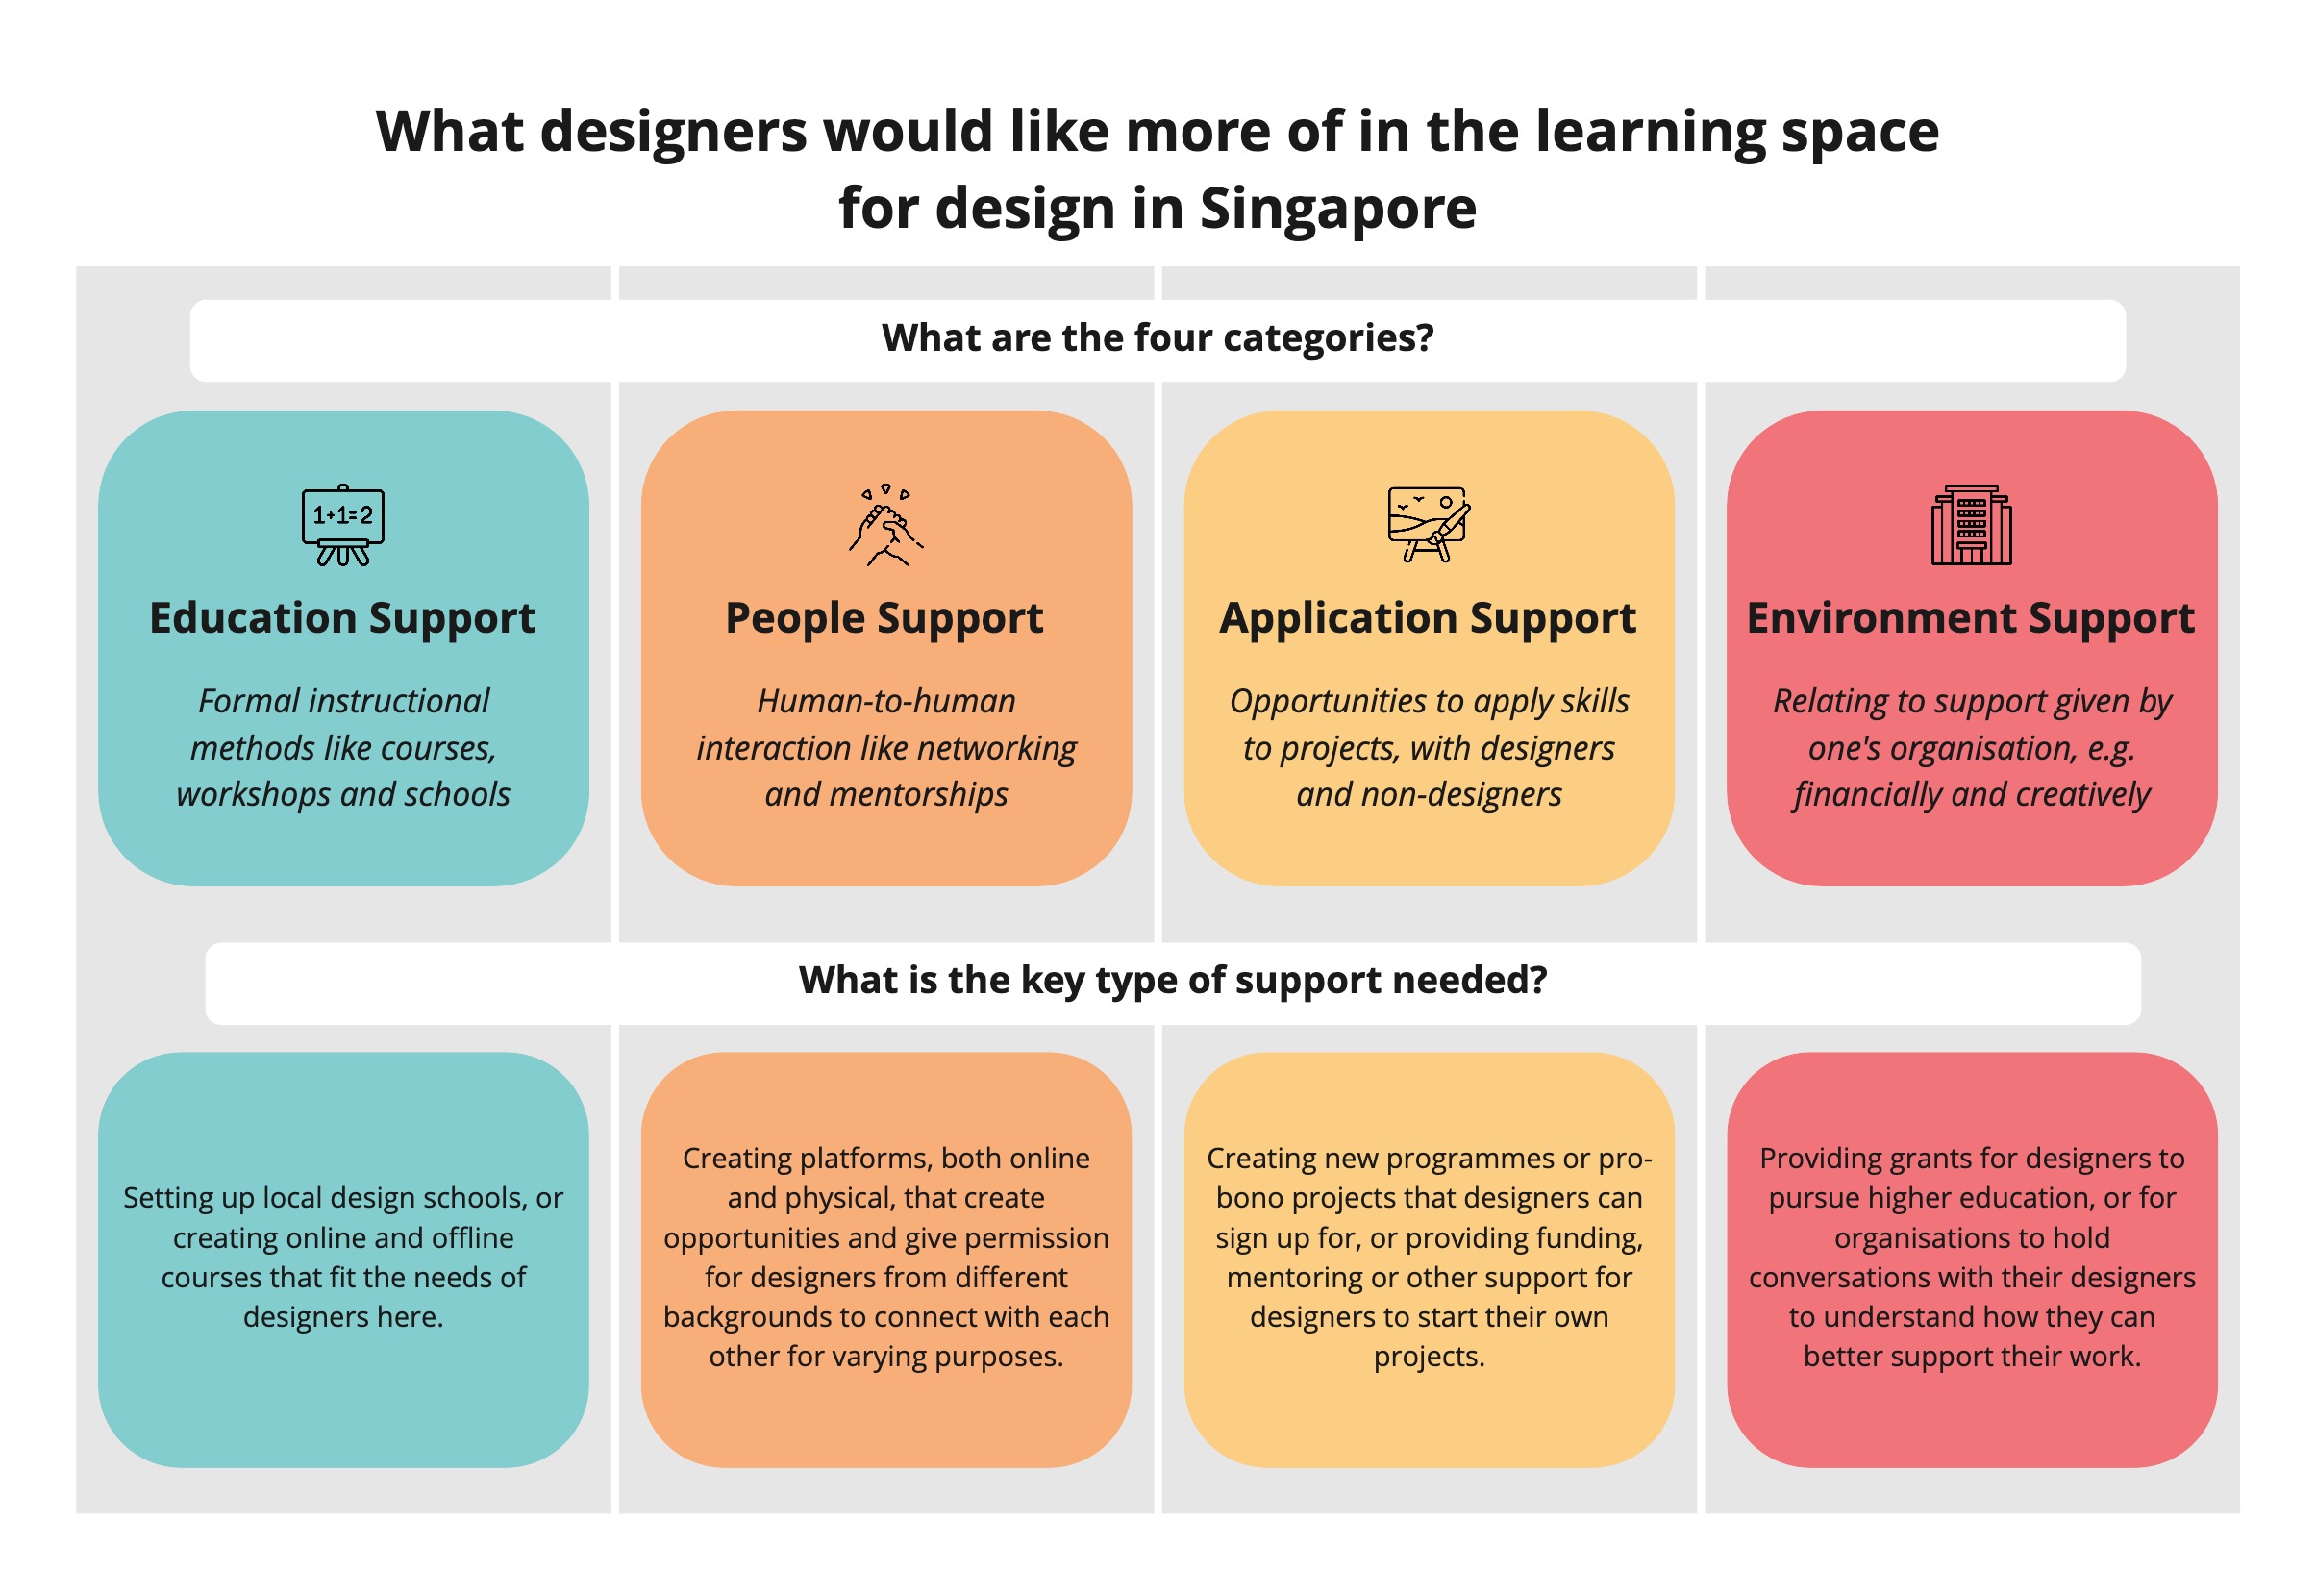
- Education Support (E.g. Instructional activities like courses, workshops, and schools).
- People Support (E.g. Exchange of ideas among people, meeting people, guidance between people including mentorship/coaching)
- Application Support (E.g. Opportunities to apply what is learnt, opportunities to collaborate on projects both within designers and with non-designers)
- Environment Support (E.g. relating to support given by the space or organisation such as financial support for trainings or flexibility for creativity)
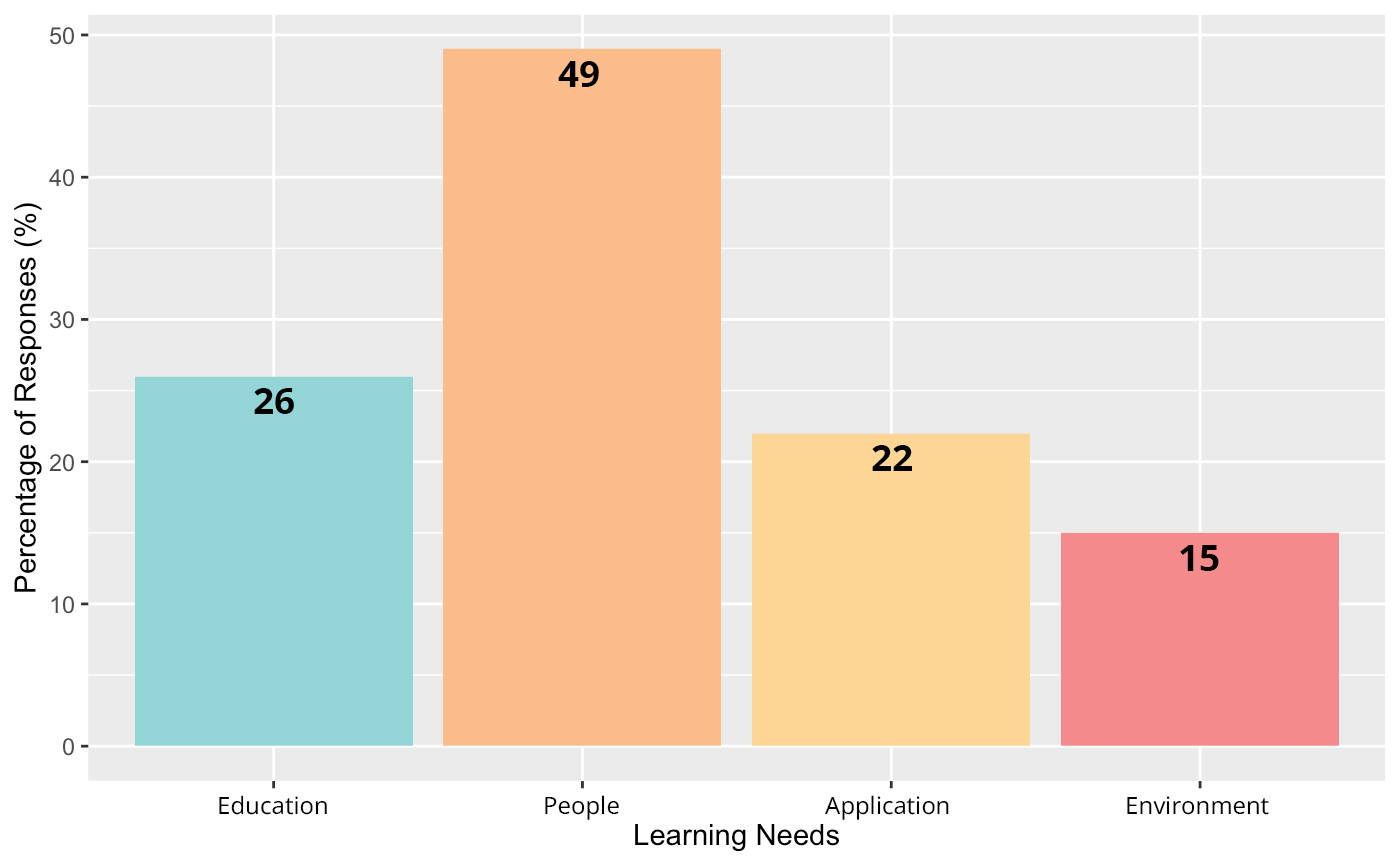
The distribution of responses according to these four categories is as follows:
My Top 5 Thought-Provoking Insights
After comparing all the different variables against each other in multiple different ways, I have identified the five graphs that presented the most thought-provoking observations to me. These five graphs correspond to the five key insights I presented in my previous summarised article. I have grouped the graphs into three groups, according to which of the three sets of relationships they investigate.
Relationship #1: Who They Are & Learning Interest
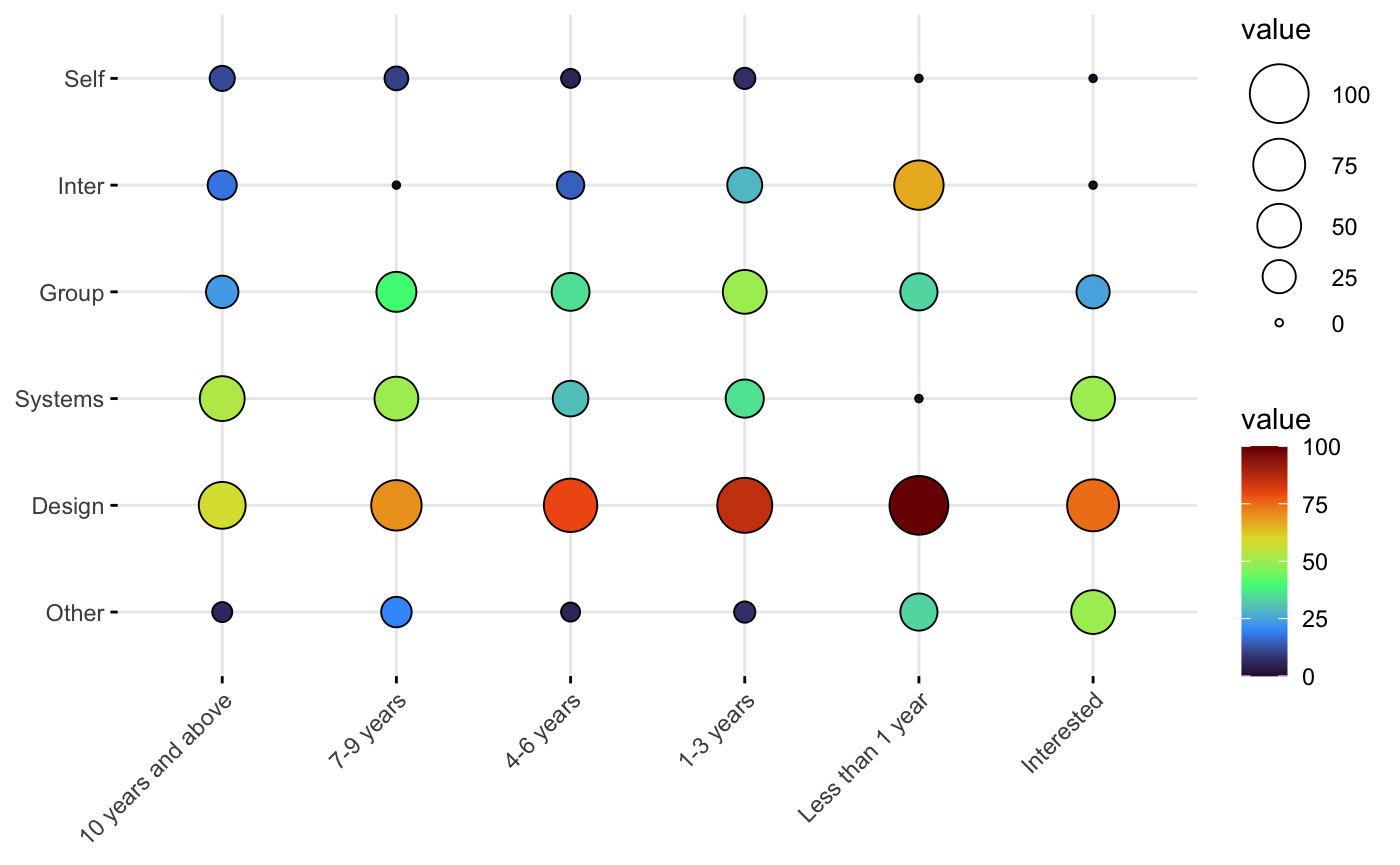
1. Junior designers are more interested in interpersonal-level and group-level skills, while senior designers are more interested in systems-level skills.
Question Asked
What might be the relationship between the years of experience an individual has in the design field and what they are currently interested to learn?
Graph Used
To see the broad trends, I plotted a balloon plot, which shows the percentage of individuals in a given experience group that indicated interest in a given area of interest. The percentage is colour-coded and reflected in the size of the “balloon” as shown in the legend on the right.
Key Insights
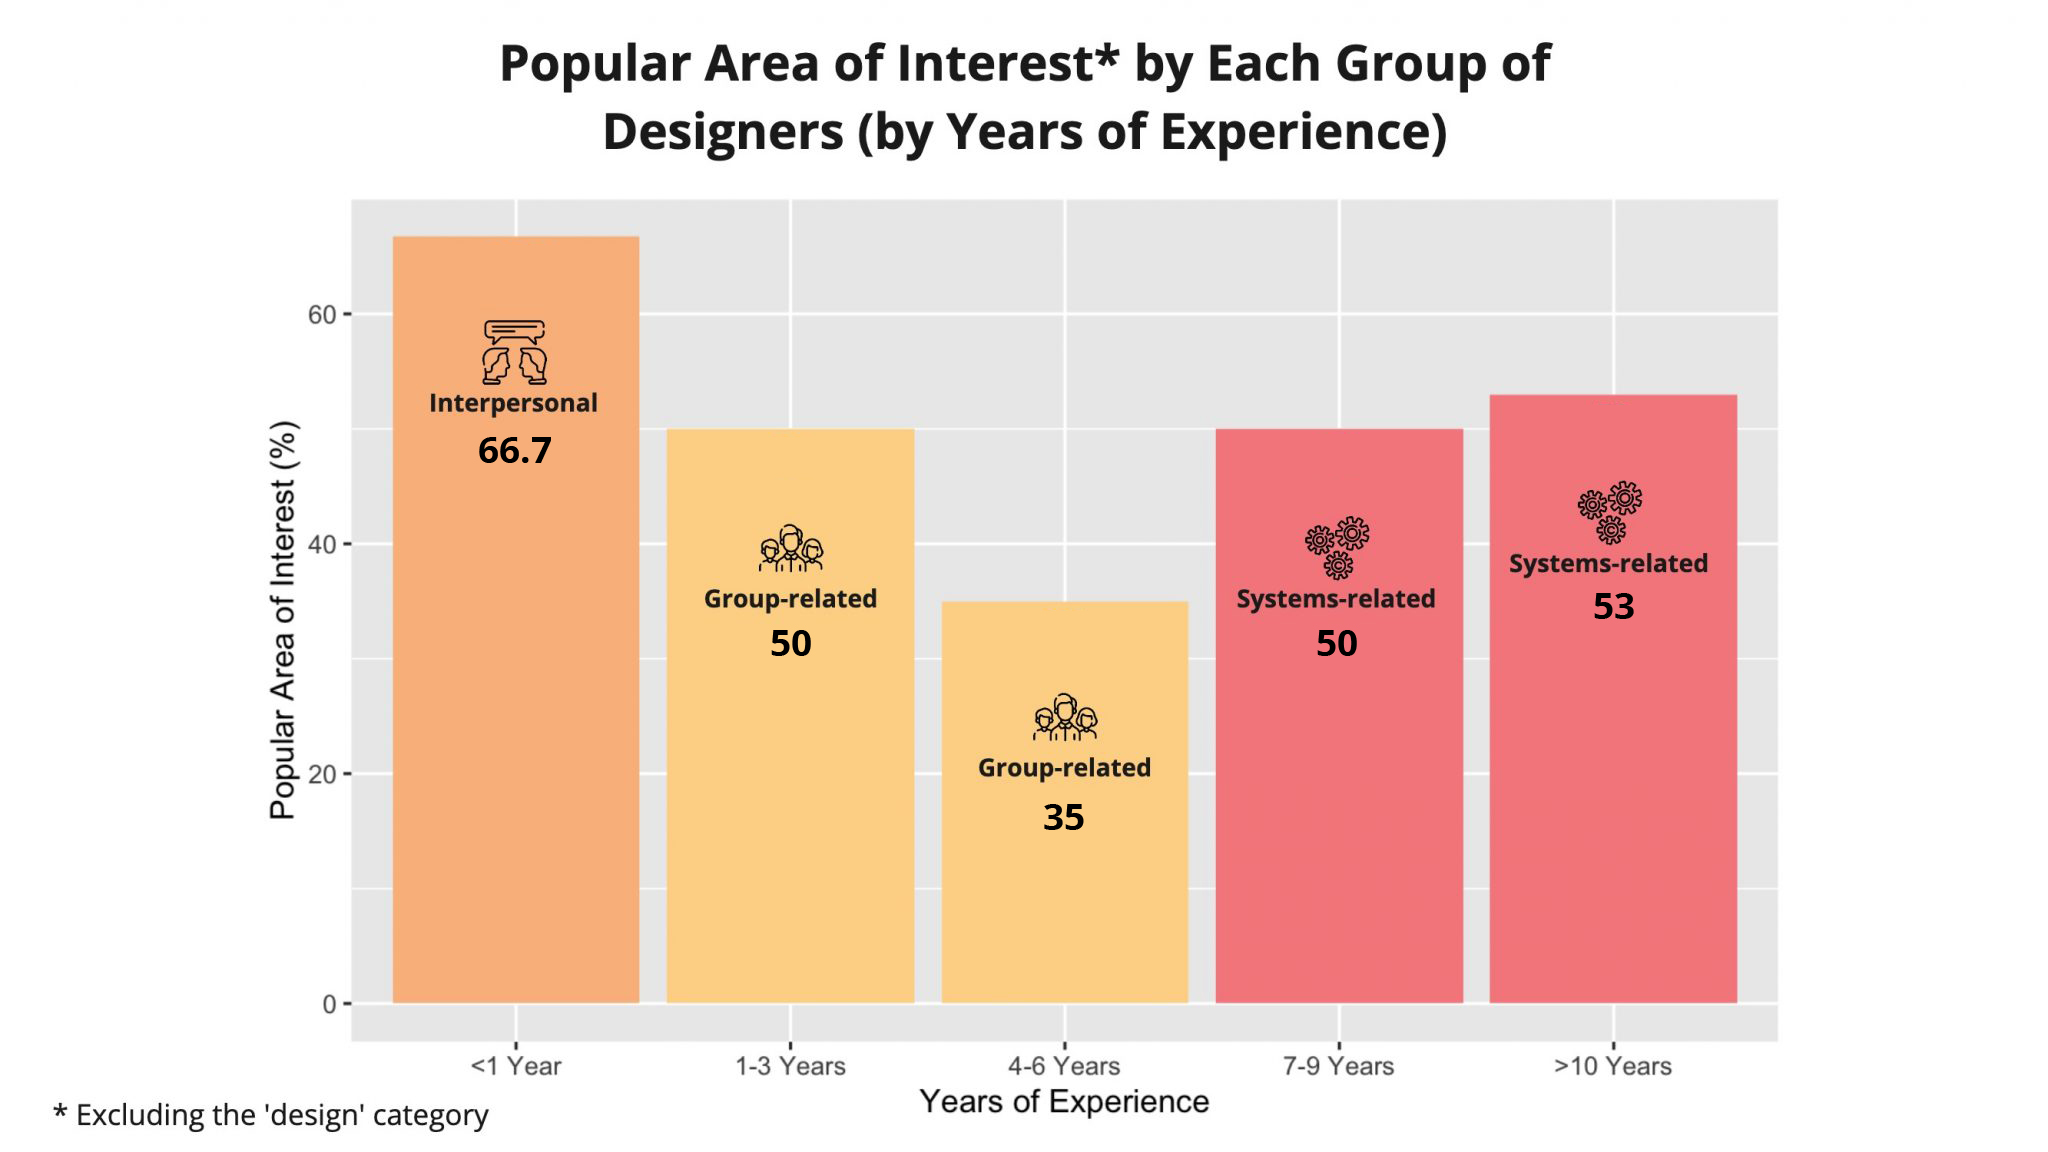
Junior designers are more interested in interpersonal-level and group-level skills, while senior designers are more interested in systems-level skills. While the difference is slight as times, the general trend suggests that senior designers turn their focus towards areas like and strategy and business management (‘systems-related skills’) as they pick up leadership and management roles in their organisations. Meanwhile, junior designers with 1-6 years of experience work more in smaller teams and therefore are more interested in picking up skills relating to working in those teams.
- 59% of designers with more than 10 years of experience indicated interest in systems-related skills, compared to 36% with 1-3 years of experience, and 0% with less than a year of experience.
- 50% of designers with 1-3 years of experience, and 35% of designers with 4-6 years of experience, indicated interest in group-related skills, compared to 23% with more than 10 years of experience.
- 66% of designers with less than 1 year of experience, and 29% of designers with 1-3 years of experience, indicated interest in interpersonal-related skills, compared to 17% with more than 10 years of experience, and 0% with 7-9 years of experience.
In general, interest in design-related skills was highest across the designers’ years of experience.
- Of all the respondents, designers with 1-3 years of experience were most interested in design-related skills, with 85% indicating interest in one or more design-related skills. Interest in design-related skills declined slightly with individuals that are more experienced, but remained high as the most popular area of interest. Of the designers with more than 10 years of experience, 59% indicated interest in design-related skills.
- I had originally expected to see interest in design-related skills decline more rapidly as designers gain experience in the field, as they turn their attention to leadership or strategy roles. However, the results suggest that senior designers here are keen on upgrading and expanding their design skillsets to better support the work that they do.
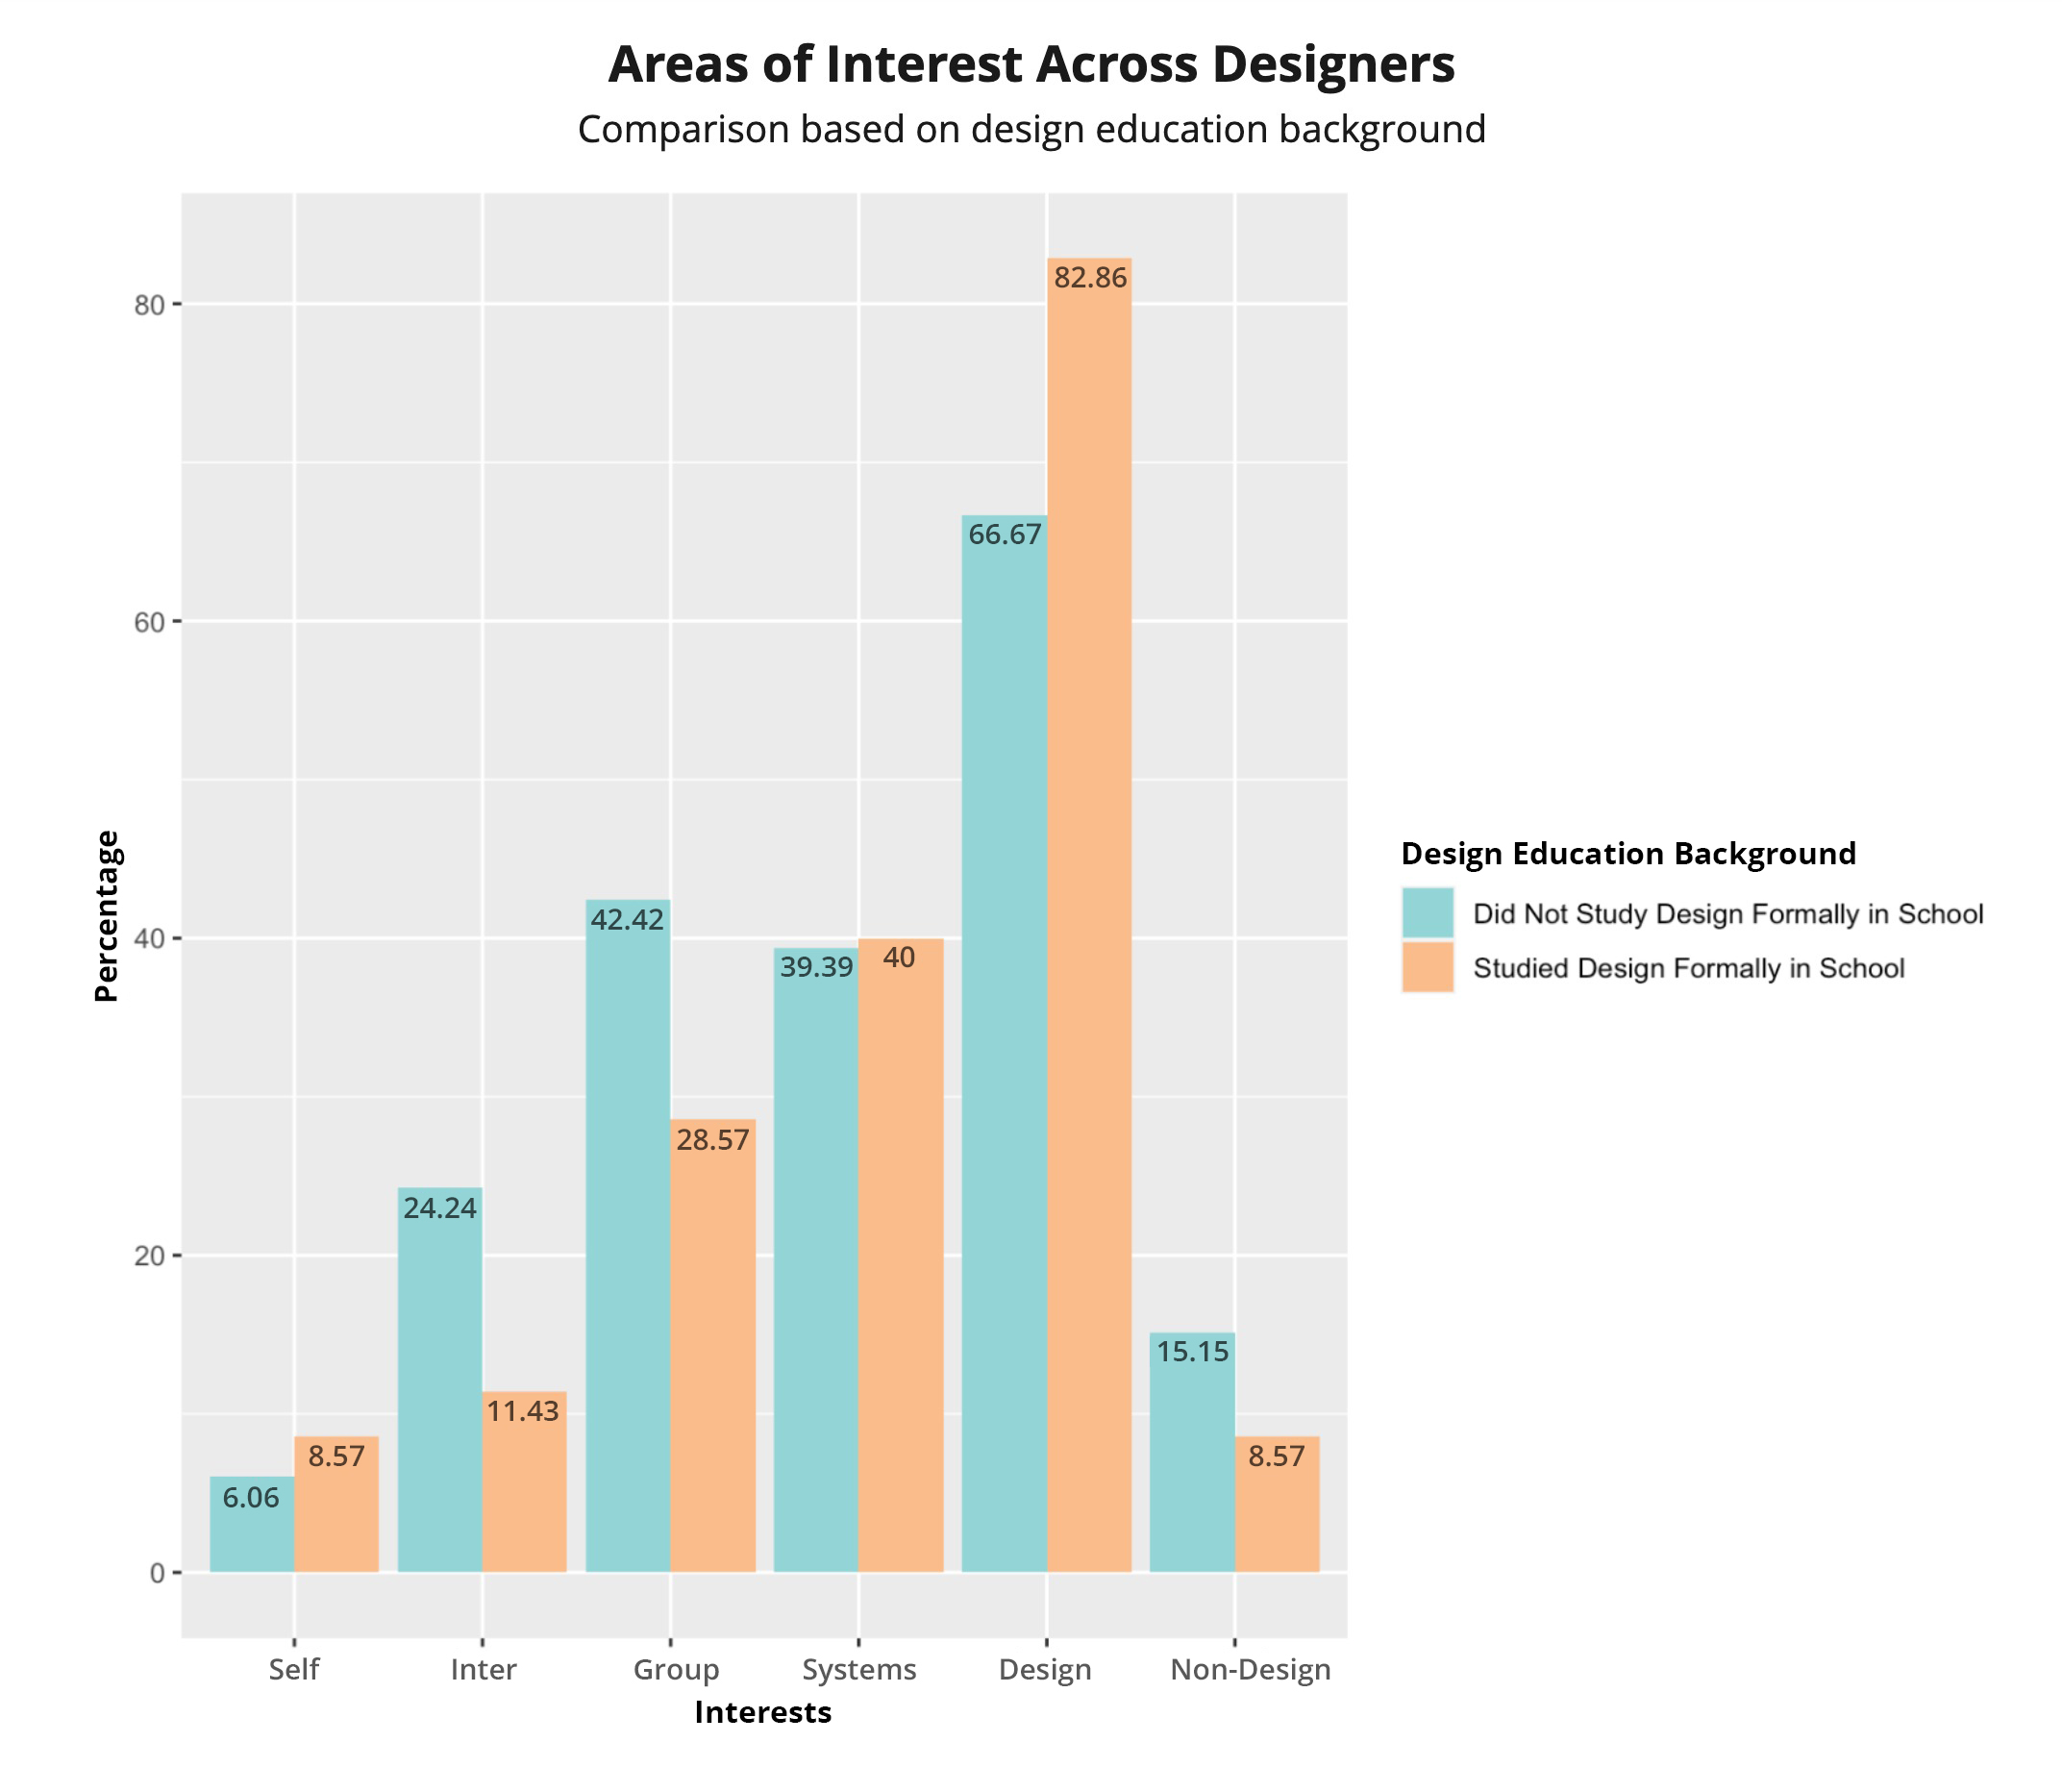
2. Designers who have studied design formally in school are more interested in learning design-related skills than designers who have not.
Question Asked
Are there significant differences in learning interests between designers who have formally studied design in school and designers who did not formally study design in school?
Graph Used
Since the variable for ‘formally studied design or not’ is binary, I used a bar chart to clearly illustrate the differences between designers who have studied design formally and those who have not, for all six areas of interest.
Key Insights
Designers who have studied design in school formally are more interested in learning design-related skills than designers who have not.
- According to the survey results, 83% of respondents who had learnt design formally were interested in design-related skills, compared to 67% of respondents who had not learnt design formally.
Instead, designers who have not studied design formally seem more interested in picking up interpersonal and group-related skills.
- 43% of designers who did not study design formally in school indicated interest in group-related skills, compared to 29% of the other group.
- 24% of designers who did not study design formally in school indicated interest in interpersonal-related skills, compared to 11% of the other group.
These results were counter-intuitive to me because I had expected to see designers who had not studied design formally to be interested in picking up new design skills to support their work, while designers who have already studied design formally would be more focused on applying the theory and skills that they have learnt.
However, the difference shown in the results could be due to a variety of underlying variables, like job responsibilities or personal career goals. It might also be possible that designers who have gone through formal design training have more language or skills for further self-directed learning in design, or they tend to pay more emphasis on honing their design skills rather than focusing on soft skills like facilitation and team management.
Relationship #2: Learning Interest & Learning Space Needs
This section tries to understand the relationship between current learning interests and identified needs in the learning space and vibrancy score given.
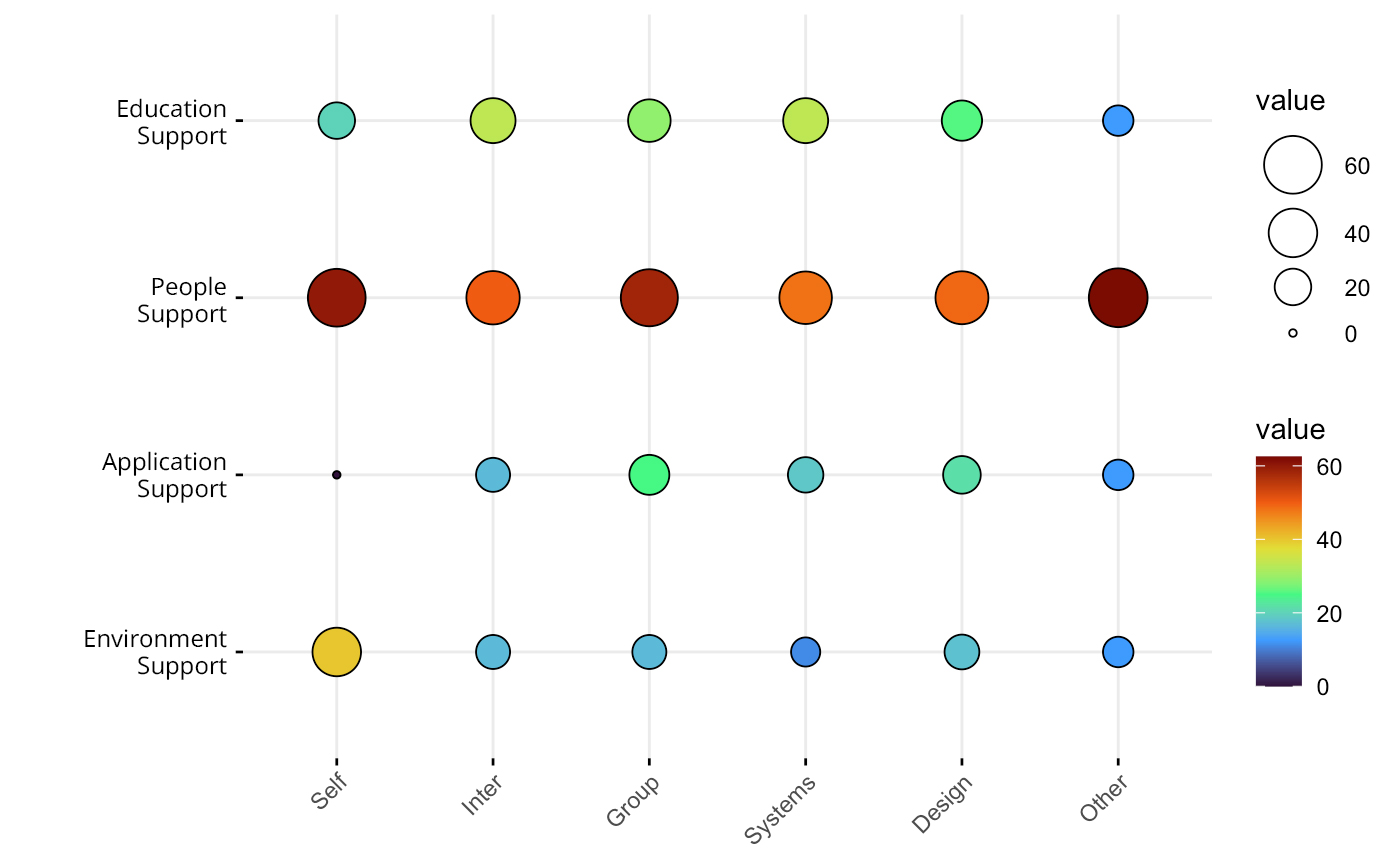
3. All designers, regardless of what they are currently interested in learning, want to see more human-to-human interaction and connection in the learning space for designers in Singapore.
Question Asked
Do respondents’ current learning interests influence what they find lacking in the learning space?
Graph Used
I used a balloon plot to visualise these results. Both variables consist of very generically clustered data, with clusters that I created as discussed above in About the Approach. Furthermore, an individual can fall under more than one category for learning interest and more than one category for learning space, which is frequently the case. Thus, each “balloon” in this plot should be read as ‘the percentage of people who are currently personally interested in [XXX] who indicated they they wanted to see more [YYY] in the learning space.’
Key Insights
Regardless of skills they were interested in learning, about half of the respondents wanted to see more people-related support in the community. Ideas that fall under ‘People Support’ include exchanging of ideas among designers or across industries, meeting or networking with fellow designers, and guidance between designers such as mentorship and coaching. This was in contrast to the interest in the next most popular option of ‘education-related support’, which averaged at around 30%.
I had expected to see each area of interest having a different type of support that they most wanted to see in the learning space. For example, designers who are interested in systems-related skills like systems thinking and strategic thinking might need better courses and workshops, while designers who are interested in picking up interpersonal and group skills might need more support from their team or superiors at work, which fall under ‘Environment support’. However, 49% of responses mentioned the need for more opportunities for things like discussions, peer-to-peer learning, and mentoring, instead of the traditional lecture or online course methods. Hence, it might be likely that designers in general feel that there is a need to connect and interact with fellow designers more, and that there is currently a shortage of opportunities for them to do so in the learning space here.
It is also possible that the COVID-19 restrictions in the past 1.5 years may have cut down on the opportunities for networking and connecting with other designers, which would contribute to this sentiment.
“[I would like to have more] peer to peer learning, workshops, [that is], active engagement and practice rather than just listening to speakers.”
Relationship #3: Who They Are & Learning Space Needs
4. Most senior designers find the learning community lacking in vibrancy, while most junior designers find the learning community more vibrant.
Question Asked
Are there possible patterns or trends between the years of experience an individual has and how vibrant (scale of 1 to 10) they find the learning space?
Graph Used
Stacked barchart. This type of graph provides two types of information at once; in this case, it shows us the number of individuals in each category of experience and the proportion of vibrancy scores of each category.
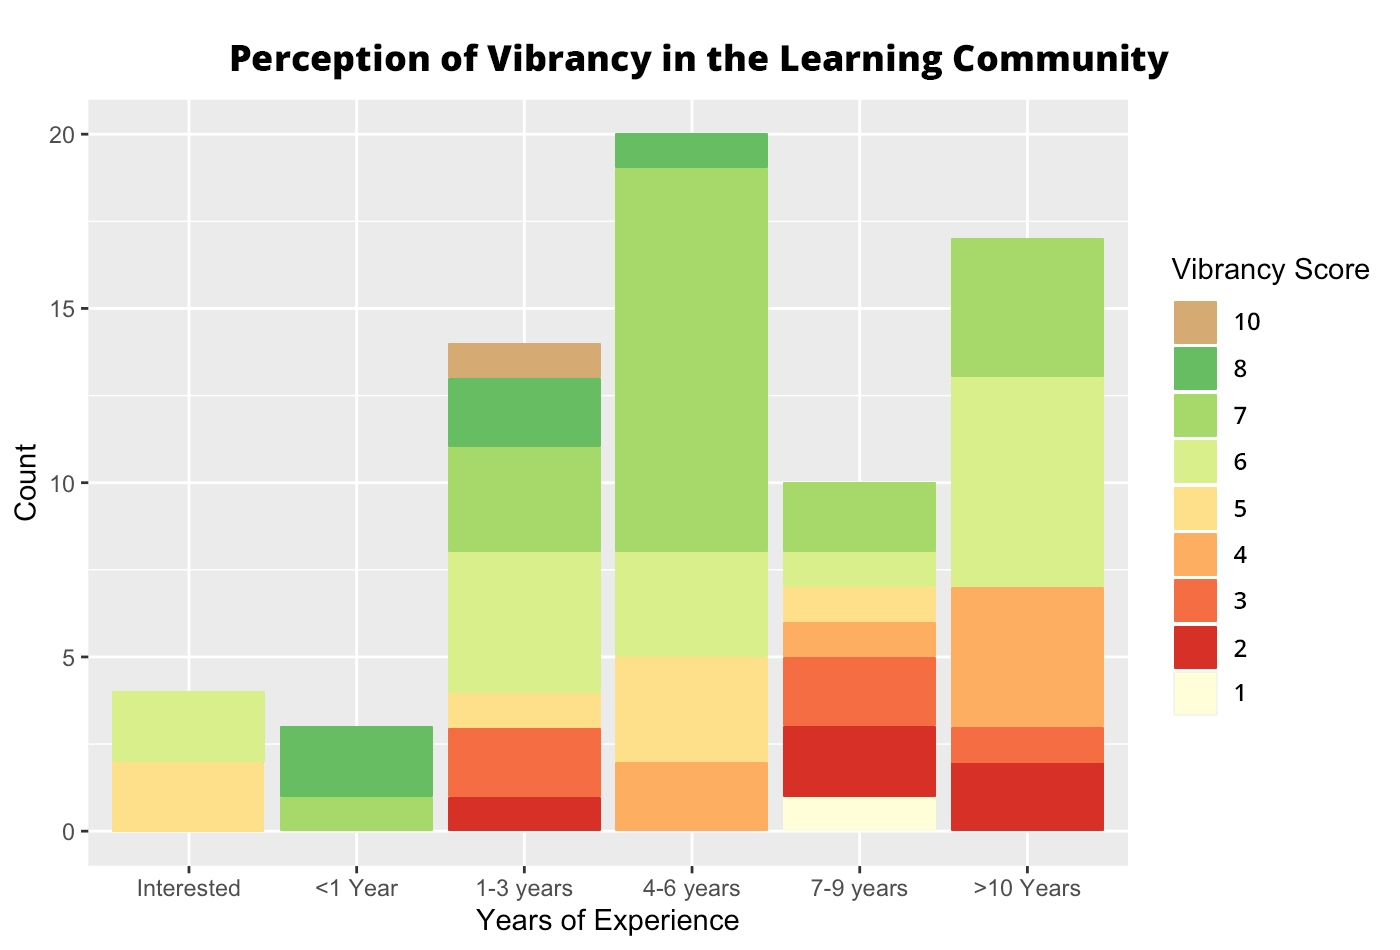
On a scale of 1 to 10, 70% of the designers with 7-9 years of experience scored the vibrancy of the learning community 5 and below, while over 70% of designers between 1-6 years of experience scored it above 5. Additionally, only designers between 0-6 years of experience gave scores higher than 7.
I had originally hypothesised that the more experience an individual had in the design field, the more vibrant they would find it to be, because they may pick up more connections and resources along the way which were not readily accessible to a fresh grad/new designer. Instead, it may be the case that the learning space for designers are actually geared toward meeting the needs of new or junior designers, and insufficient attention is paid to more senior designers and their needs.
Scoring type questions are also more difficult to analyse because what the numbers mean may vary between individuals. We also left the term ‘vibrancy’ up to the designers’ own interpretation, and did not define the term in the survey question.
“[I hope to see] intermediate or advanced learning and discussions. Now the Telegram group or meet ups are junior heavy.”
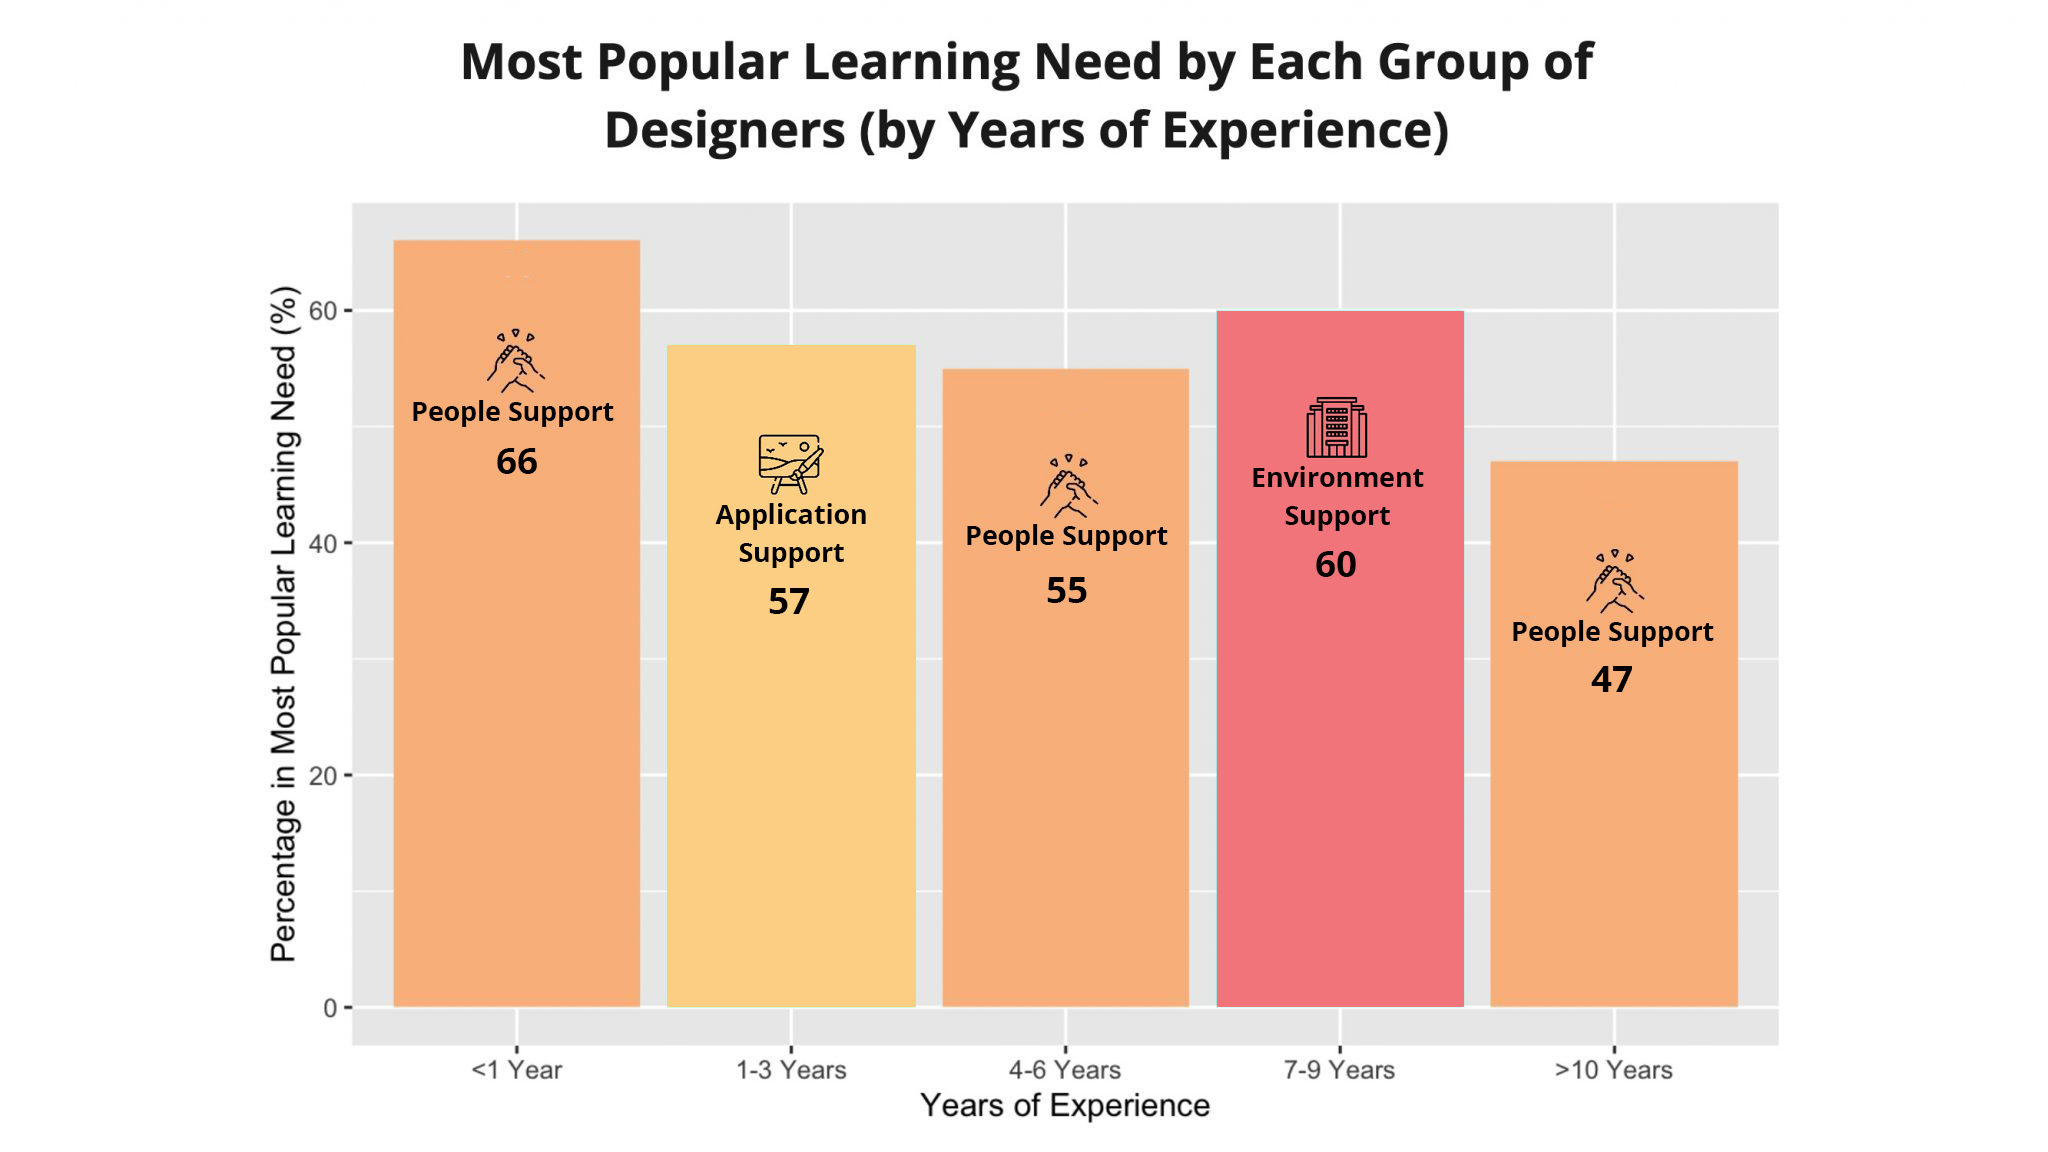
5. Senior designers with 7-9 years of experience most want support from their employees or companies, while senior designers with more than 10 years of support want courses and peer groups catered to them.
Question Asked
Do designers with different years of experience need different types of support from the learning space?
Graph Used
Balloon plot.
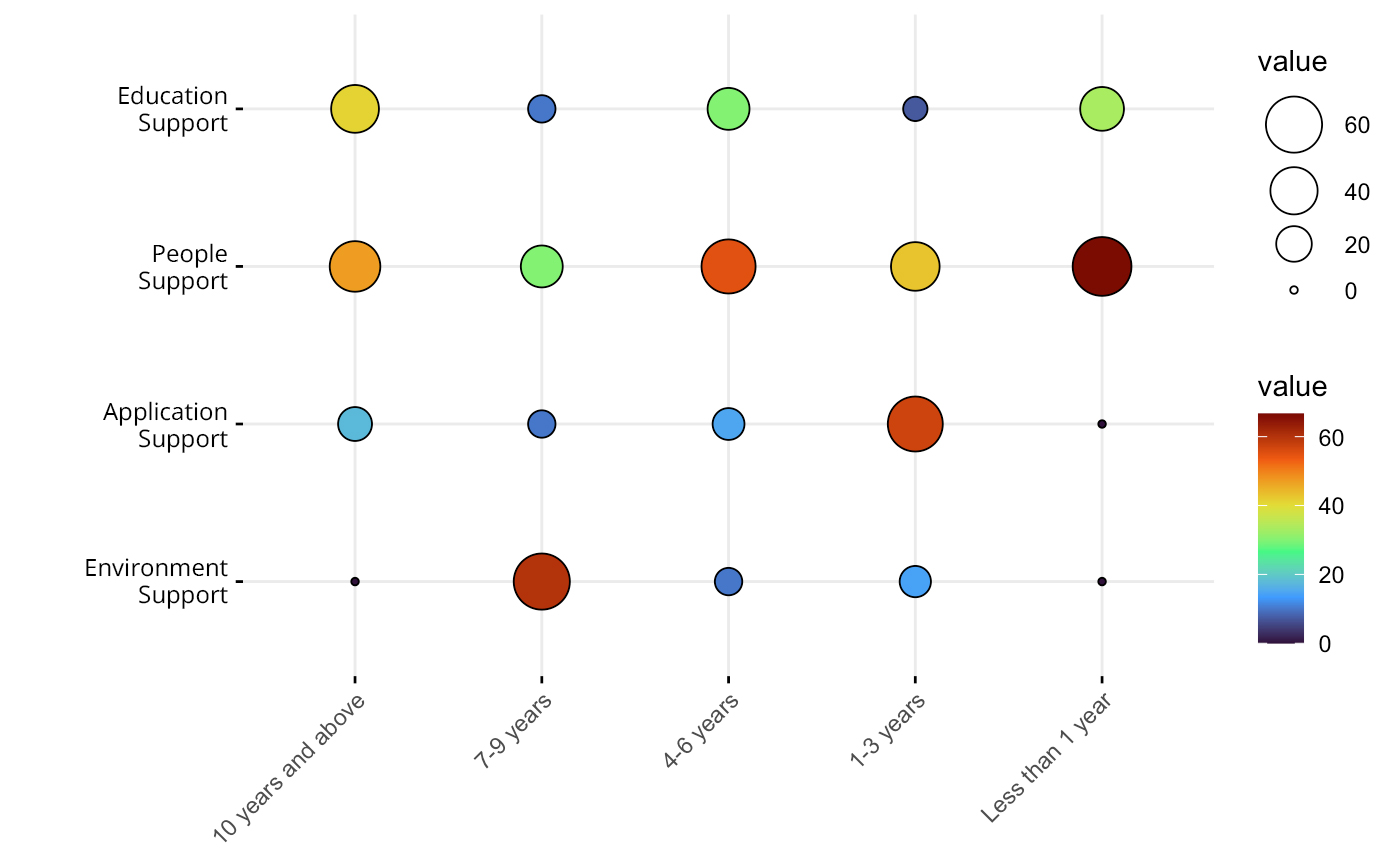
“[I would like to see] more mentorship at the junior and senior levels, courses and peer groups for senior designers stepping into design leadership and management.”
Key Insights
The most popular option for each group of designers are as follows:
“[I would like] for agencies and leaders to understand the design and the creative process and not expect it to be 100% linear, for them to allow their briefs to be challenged and shaped by the design consultancy.”
- 66% of designers who had less than a year of experience in design wanted to see more people-related support (meetups, mentorships, etc.)
- 57% of designers with 1-3 years of experience wanted to see more application-related support.
- 55% of designers with 4-6 years of experience wanted to see more people-related support.
- 60% of designers with 7-9 years of experience wanted to see more environment-related support.
- 47% of designers with more than 10 years of experience. wanted to see more people-related support.
This question intended to have a quick sense of whether individuals of different seniority experience the learning space differently. It was interesting to see that designers with specifically 7-9 years of experience seemed most frustrated with the perceived lack of support from their organisations, citing the lack of financial support for further trainings and creative freedom in projects as things they wished to see improved upon. It made me wonder if designers at this specific stage in their career experienced these restrictions more keenly than other designers due to their job responsibilities, or if there are other reasons at play.
Furthermore, it was interesting that designers with more than 10 years of experience seem to experience a resurgence of interest in seeing more education support in the learning space, with 41% responding that they hope to see more in-depth courses catered to senior designers (in topics like systems thinking and futures thinking). These results suggest that there is a lack of quality courses specifically catered to designers who are taking on leadership positions in their organisations. Furthermore, as mentioned in the fourth insight, some senior designers also feel that there is a lack of peer groups catered for them to discuss issues that are more relevant to them.
Conclusion
Statistical significance, limitations of the study, and what’s next.
Statistical Significance
To test whether the results I’ve obtained are statistically significant (or if they were just the result of random variation present in the data), I ran chi-squared tests on each of the five insights. Using the in-built function chisq.test() in R, I obtained p-values of lesser than my default significant level of 0.05. This means that the probability of obtaining the results I have discussed above given the fact that the results are due to randomness is less than 5%. More specifically, the p-values of insights 1, 3 and 5 are close to 0, while the p-values of insights 2 and 4 are 0.055 and 0.016 respectively. While the p-value of insight 4 is slightly higher than 0.05, I decided to still accept the results because of how small the difference is.
Limitations
There are several limitations to this study that I would like to discuss, that are likely to have affected the results I have presented here. I hope that these issues could be addressed by future follow-up studies.
First, the survey we conducted is intended as a preliminary quantitative scan of the general sentiments towards the learning space in Singapore. Thus, based on the insights that have been identified, future studies could go further in-depth into the lived experiences of designers from different backgrounds, through interviews and qualitative methods of analysis.
Second, significant focus was placed on certain variables like years of experience and vibrancy score because they were easiest to plot in R and generally representative of the three themes of interest. Hence, responses from other survey questions were not looked at in this analysis. Furthermore, the current method of clustering the data leaves out some important nuances of the responses and the requests. As mentioned in About the Approach, a different method of clustering could bring to surface a different set of insights. To give readers a sense of the data we’ve received, I’ve included quotes of some of the responses we have received throughout this article.
Lastly, we received a considerable number of responses when we sent out the survey, but the sample size is still quite small for a quantitative study, especially for some demographics like designers with 0-3 years of experience or designers with 7-9 years of experience. Thus, the insights generated may not be broad enough to cover the whole spectrum of experiences faced by a designer in Singapore, and are heavily influenced by the responses we had received.
So…What’s Next?
What can senior designers or leaders do to improve the learning space for designers in Singapore? What can junior and senior designers both do to find the support they need for their own development and for the development of the design scene in Singapore? While these insights do not provide direct answers, I hope that by sharing a sense of what fellow designers are also experiencing in this space, you might be encouraged to start a conversation with your colleagues or friends about what interests and plans you may have for your design career, and consider how you might be able to help support each other.
Otherwise, thank you so much for taking the time to read the article! If you’ve found this article helpful, feel free to share it with your colleagues and friends. Or if you would like to share some of your thoughts or feedback you may have from reading this article, feel free to do so in the comments below.
Take care! 🙂